Calculation of Hardware Architecture Metrics PMHF, SPFM, LFM
- Anunay Krishnamurthy

- Feb 7
- 6 min read
Updated: Mar 19
One of the key objectives of ISO 26262 Part 5 is the evaluation of hardware architecture metrics to assess the robustness of an electrical/electronic (E/E) system against random hardware failures. This evaluation is performed using three core metrics:
PMHF - Probabilistic Metric of Hardware Failure
SPFM - Single Point Fault Metric
LFM - Latent Fault Metric
Together, these hardware architecture metrics provide a quantitative basis for assessing the final E/E hardware design by applying ASIL-dependent pass/fail criteria. They help determine whether the implemented hardware architecture and safety mechanisms are sufficient to detect, control, or mitigate single-point and latent faults, ultimately supporting confidence in the system’s functional safety compliance.
PMHF - Probabilistic metric of HW failure
The Probabilistic Metric for Random Hardware Failures (PMHF) represents the average probability of a hardware-related failure per hour, calculated over the operational lifetime of the item. PMHF provides a quantitative measure of how frequently random hardware failures are expected to occur and is a key metric used to demonstrate compliance with ISO 26262 hardware safety requirements.
The PMHF is typically expressed in FIT (Failure In Time), which is defined as the number of failures per one billion hours of operation:
1 FIT = 10e-09 failures/hour (1 failure in 1 billion hours of operation)
10 FIT = 10e-08 failures/hour (10 failure in 1 billion hours of operation)
100 FIT = 10e-07 failures/hour (100 failure in 1 billion hours of operation)
ISO 26262 provides two primary approaches for demonstrating that the hardware architecture meets the required safety integrity with respect to random hardware failures.
Method 1: Failure Rate Class Analysis: This approach is based on the ASIL level, assumed component failure rates, and the presence of diagnostic coverage and safety mechanisms. Using these inputs, a structured safety argument is developed to show that the hardware architecture is sufficiently robust against random failures, without explicitly calculating a PMHF value.
Method 2: PMHF Calculation: This quantitative approach involves explicitly calculating the PMHF for the item using detailed failure rate data, diagnostic coverage, and architectural assumptions, typically derived from an FMEDA. The resulting PMHF value is then compared against ASIL-dependent target limits defined in ISO 26262 to demonstrate compliance.
ASIL | Target PMHF |
ASIL D | < 10e-08 (< 10 FIT) |
ASIL C | < 10e-07 (< 100 FIT) |
ASIL B | < 10e-07 (< 100 FIT) |
Table: ASIL dependent Random Failure rate according to ISO 26262
In practice, Method 2 is more commonly used for complex E/E systems, as it provides a clearer, calculation-based justification of hardware safety integrity.
Using Method 2, PMHF is calculated using the formula
MPMHF = [ Lambda SPF (λSPF) ] +
[ Lambda RF (λRF)] +
[ Lambda DPF_det x Lambda DPF_latent x Tlifetime ]
where,
MPMHF -----> is the PMHF value determined
Lambda SPF (λSPF) -----> is the single point failure rate (faults that don't have a safety mechanism and can lead to a hazard)
Lambda RF (λRF) -----> is the residual fault failure rate (faults that are not covered by a safety mechanism and can lead to a hazard)
Lambda DPF_det -----> is the dual point failure rate where a failure of a component is detected by a mechanism
Lambda DPF_latent -----> is the latent dual point failure rate
Tlifetime -----> is the vehicle lifetime
The term [ Lambda DPF_det x Lambda DPF_latent x Tlifetime ] -> This represents multiple point fault i.e. there is a fault in the system that is supposed to be detected by a safety mechanism, but the safety mechanism does not function correctly.
The video below provides more information on how the PMHF can be calculated.
SPFM - Single Point Fault Metric
The Single Point Fault Metric (SPFM) is a measure of how robust an item is against single-point and residual faults, either through coverage provided by safety mechanisms or through inherently safe design (primarily safe faults).
The target Single Point fault metric depends on the ASIL
ASIL | Target SPFM |
ASIL D | >= 99% |
ASIL C | >= 97% |
ASIL B | >= 90% |
Table: ASIL dependent SPFM according to ISO 26262
SPFM is calculated using the formula below
SPFM =
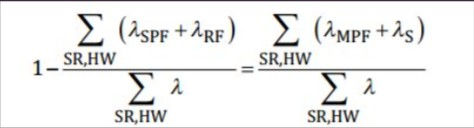
where,
Lambda SPF (λSPF) -----> is the single point failure rate (faults that don't have a safety mechanism and can lead to a hazard)
Lambda RF (λRF) -----> is the residual fault failure rate (faults that are not covered by a safety mechanism and can lead to a hazard)
Lambda MPF (λMPF) -----> is the failure rate associated with multiple point faults
Lambda S (λS) -----> is the failure rate associated with safe faults
Lambda (λ) -----> is the sum of all failures i.e. λ = λSPF + λRF + λMPF + λS
The figure below shows an example distribution of failure rates for a system. The section in green represents the single point faults, Lambda SPF (λSPF). The section in blue represents the residual faults, Lambda RF (λRF).

Figure: Example of a failure rate distribution of a system
A high SPFM indicates a higher level of robustness against single-point faults, meaning that few failures can directly lead to a violation of a safety goal. Conversely, a low SPFM reflects a lower robustness, where single-point faults are more likely to result in hazardous behavior.
To increase the SPFM, one or a combination of the following strategies can be applied:
Reduce the single-point fault failure rate (λSPF) - This is achieved by designing the hardware such that single-point faults are eliminated or minimized, through redundancy, fail-safe design principles, or the use of inherently safe components.
Reduce the residual fault failure rate (λRF) - This typically involves improving diagnostic coverage, so that faults are detected and controlled by safety mechanisms before they can lead to a hazardous condition.
Increase the total failure rate (λ) - While this would mathematically increase the SPFM, it is not a meaningful or acceptable design approach, as it simultaneously increases the PMHF and degrades overall system reliability. As a result, this option is not considered a valid engineering strategy.
In practice, improving SPFM is almost always driven by architectural changes and better diagnostics.
The video below provides an explanation on how the SPFM can be calculated.
LFM - Latent Fault Metric
The Latent Fault Metric (LFM) is a measure of the robustness of an item against latent multiple-point faults, either through coverage provided by safety mechanisms, through inherently safe design (primarily safe faults), or through fault recognition by the user.
The target Latent fault metric depends on the ASIL
ASIL | Target LFM |
ASIL D | >= 90% |
ASIL C | >= 80% |
ASIL B | >= 60% |
Table: ASIL dependent LFM according to ISO 26262
LFM is calculated using the formula below
LFM =

where,
Lambda MPF, L (λMPF,L) -----> is the failure rate associated with hardware element latent faults
Lambda MPF, DP (λMPF,DP) -----> is the failure rate associated with hardware element perceived or detected multiple-point faults
The figure below shows an example distribution of failure rates for a system. The section in orange represents multiple point faults. This section in orange represents both multiple point latent faults, Lambda MPF, L (λMPF,L) and detected/ perceived multiple point faults, Lambda MPF, DP (λMPF,DP).

Figure: Example of a failure rate distribution of a system
A high LFM indicates a higher level of robustness against latent multiple-point faults, meaning that such faults are either detected, revealed, or rendered safe before they can contribute to a hazardous situation. Conversely, a low LFM reflects a lower robustness, where latent faults may remain undetected and combine with additional failures to violate a safety goal.
To increase the LFM, one or a combination of the following approaches can be applied:
Increase the multiple-point fault detection or perception rate (λMPF,DP) - This is achieved by ensuring that latent multiple-point faults are detected by safety mechanisms or perceived by the user, for example through periodic self-tests, online diagnostics, startup checks, or clear fault indication strategies.
Increase the safe fault rate (λS) - This involves designing the hardware such that a higher proportion of faults result in a safe state, thereby reducing the likelihood that latent faults can contribute to hazardous behavior.
In practice, improving LFM is primarily driven by effective diagnostics, fault revelation strategies, and fail-safe design, rather than changes to the underlying random failure rates.
Conclusion
Hardware architecture metrics provide a quantitative and objective way to evaluate the robustness of an E/E system against random hardware failures and to demonstrate compliance with ISO 26262. By applying PMHF, SPFM, and LFM, typically derived from an FMEDA, engineers can assess whether the hardware architecture and safety mechanisms are sufficient to meet ASIL-dependent safety targets and support confident design decisions.


Comments